Setting up PHP Debugging with XDebug
Have you ever spent hours trying to figure out why your PHP web page was not working properly? Do you hate having
to add var_dump, var_export, or print statements whenever something is not working, only to remove them once
you figured out the bug? Do you wish that there was a way to pause your code and see the contents of variables in
your script? There is a PHP extension called XDebug that will allow you to do all this; it allows you to stop your
script on demand, and will allow to run your script one line at a time. The process of running your script one line
at a time is called 'stepping' through your program. XDebug allows you to step through your program, plus inspect
variables, and even run some code while your script is paused. The unfortunate thing is that XDebug does not come
with PHP by default, but the steps below will show you how to install and run XDebug. Then, I will show you how easy
it is to debug scripts with Triumph 4 PHP.
Installing XDebug
XDebug is a PHP extension. Installing PHP extension varies for each operating system, as a PHP extension contains C code that must be compiled and must be configured to be enabled.
Step 1: Verify your PHP Setup
Create a script that prints out PHP diagnostic info. Create a file called info.php in
the root of your webserver. The file should look like this:
    <?php
        phpinfo();
You will use this script to get the list of loaded PHP extensions and the locations of the PHP configuration
files. To figure out if your system already has XDebug, open your browser to http://localhost/info.php.
If you see a section for XDebug, it means that XDebug is installed! If not, you will need to install
it. If XDebug is already installed continue to step 3, otherwise read Step 2 to install XDebug.
Step 2: Install XDebug Extension
The process of instaling XDebug can vary wildy depending on how you installed PHP in your system. But if you used the most common PHP installation methods, then the instructions below should work for you.
Linux
By far the easiest way to install XDebug is to use your system's package manager.
- Ubuntu: sudo apt-get install php5-xdebug
- Debian: sudo apt-get install php5-xdebug
- Fedora: sudo yum install php-pecl-xdebug
- Fedora Using DNF: sudo dnf install php-pecl-xdebug
Mac OS X
Several options exist for installing XDebug; the most common being homebrew and macports
- homebrew: brew install php55-xdebug
- macports: sudo port install php55-xdebug
MS Windows
WAMP is used by many Windows users as it comes with a full development stack. In fact, newer version of WAMP include XDebug, all you need to do is enable the module by left-clicking on the WAMP icon then selecting PHP -> PHP Settings -> (XDebug) Remote Debug.
Step 3: Enable XDebug in php.ini
Package managers will usually update the php.ini file to enable XDebug when XDebug is installed. You
can verify this by restarting your webserver, then reloading info.php from step 1. You
should now see XDebug being loaded, as well the XDebug settings. In the browser page,
you should see at least the following settings for Xdebug:
    xdebug.remote_enable       On            On
    xdebug.remote_host         localhost     localhost
    xdebug.remote_port         9000          9000
The above config tells you that XDebug will be loaded whenever your webserver starts, and XDebug will try to communicate with the Debug client (Triumph) on localhost at port 9000. If you see the XDebug section, but the settings don't match the above settings, you can change them. The script from section 1 outputs the locations of the INI files used to configure PHP. See the sections "Loaded Configuration File" and "Additional .ini files parsed". Those section list the files that contain the XDebug settings. If you don't see the XDebug section at all it means that XDebug is still not correctly installed.
Step 4: Install a Browser XDebug Add-On
One final program to install is a PHP XDebug browser extension. The browser extension enables you to turn debug on demand on specific pages. This varies depending on whether you use firefox, chrome, or internet explorer. There are several of these plugins, but they all work the same way.
- Firefox: Install the addon "The easiest Xdebug"
- Chrome: Install the chrome extension "Xdebug helper"
Once you have the extension installed in your browser, you are ready to start!
Debugging Using Triumph
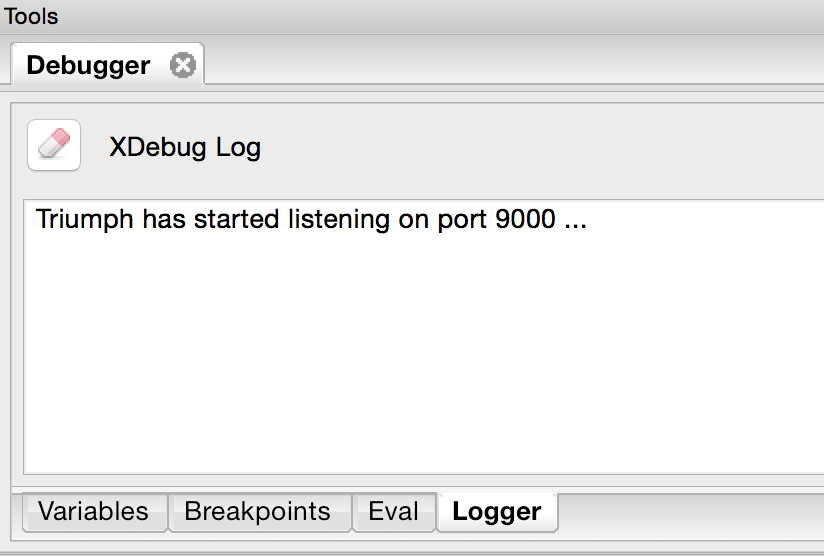
After you have verified that XDebug is installed, all you need to do is start the debug client in Triumph. Click on the 'Start XDebug Client' button in the toolbar. The debugger pane will appear in the bottom of the screen. In the logger tab, you will see the message "Triumph has started listening on port 9000 ...". This tells you that Triumph is now ready to accept connections from XDebug. On MS Windows, you may see a prompt asking you if you want to allow unblocking of port 9000, you must accept this or else debugging will not work.
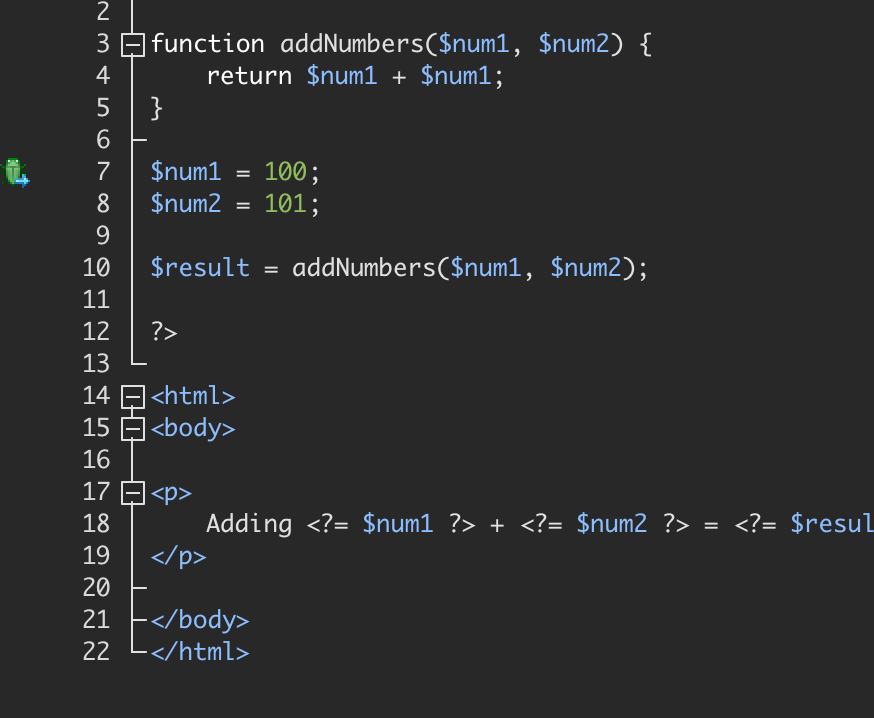
In order to take the debugger for out for a spin, we need to run a script that has a bug. Since your code is bug-free, you can add this buggy script to your project.
    <?php

    function addNumbers($num1, $num2) {
        return $num1 + $num1;
    }

    $num1 = 100;
    $num2 = 101;

    $result = addNumbers($num1, $num2);

    ?>

    <html>
    <body>

    <p>
        Adding <?= $num1 ?> + <?= $num2 ?> = <?= $result ?>
    </p>

    </body>
    </html>
Open your browser to http://localhost/buggy.php. The page renders the following text
"Adding 100 + 101 = 200" That's obviously wrong! Let's fix it!
Pausing Script Execution
We know that we want to step through this code to figure out where the bug is. We need to do two things:
- Enable debugging for this page: Click on the "Xdebug" button in your browser
- Tell XDebug where to pause execution. We do this by adding breakpoints. In Triumph, you add a breakpoint by clicking on the left margin of the line where you want to stop.
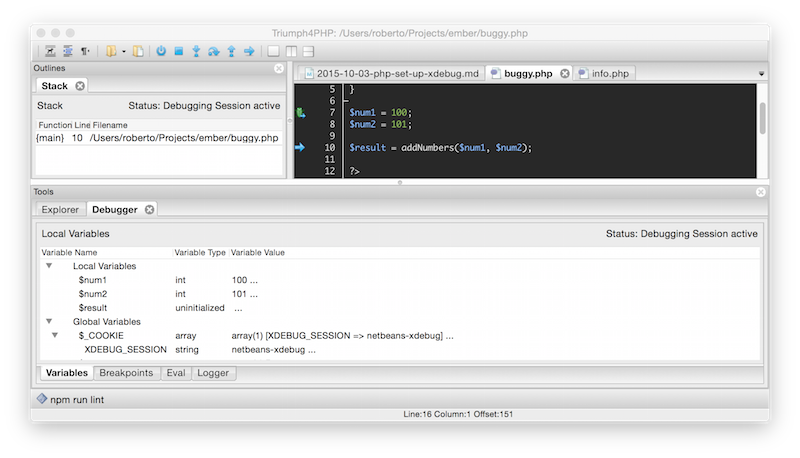
Once we do both of these, reload the page in the web browser. As soon as you reload the page, Triumph4PHP will alert you that XDebug has stopped execution. It will open the file where execution stopped and put a marker on the line where execution is stopped.
Inspecting Variables
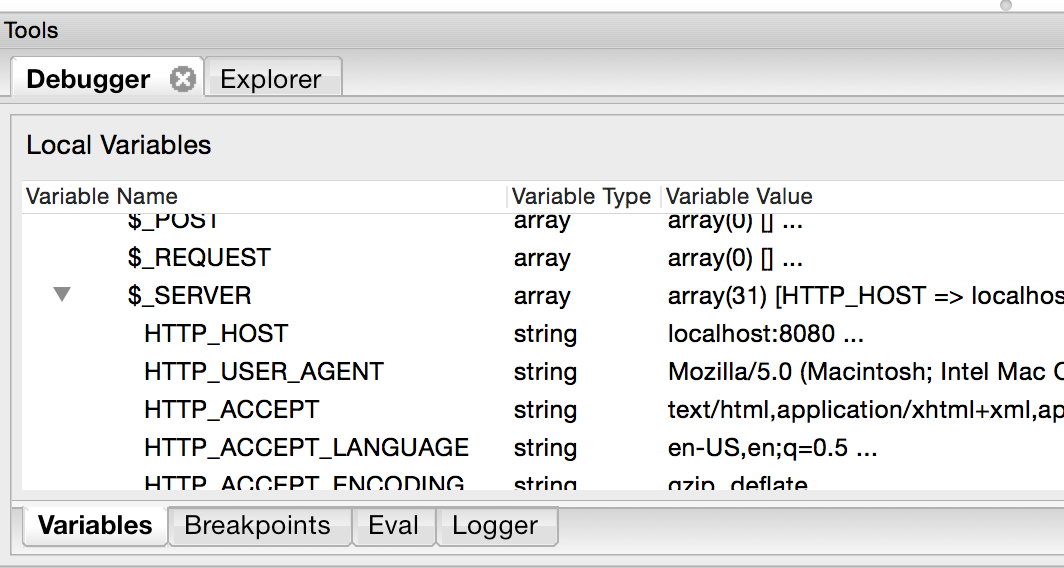
The script is paused. What does this mean? It means that the script is dormant, but it still resides in memory. You can see what line will be run next, the call stack (functions that called the current function), and the values of the variables! Triumph shows you each variable in the current scope, as well as global variables. For example, you can expand the "$_SERVER" superglobal, and you can see all of the items that the array contains.
Stepping Through The Code
Now, back to our bug. Since we stopped at the first line, we need to move forward since the next two lines are assignments. You move on by using the "step over" button two times. Now, we encounter a decision. The next line is a function call, and we have two options: either execute the first line of the function, of just execute the function in its entirety. Executing the first line of the function is called "stepping in". We do this because we suspect the bug is in this function. When you click the "Step In" button the cursor moves to the function body. This will work even if your function is on another file!
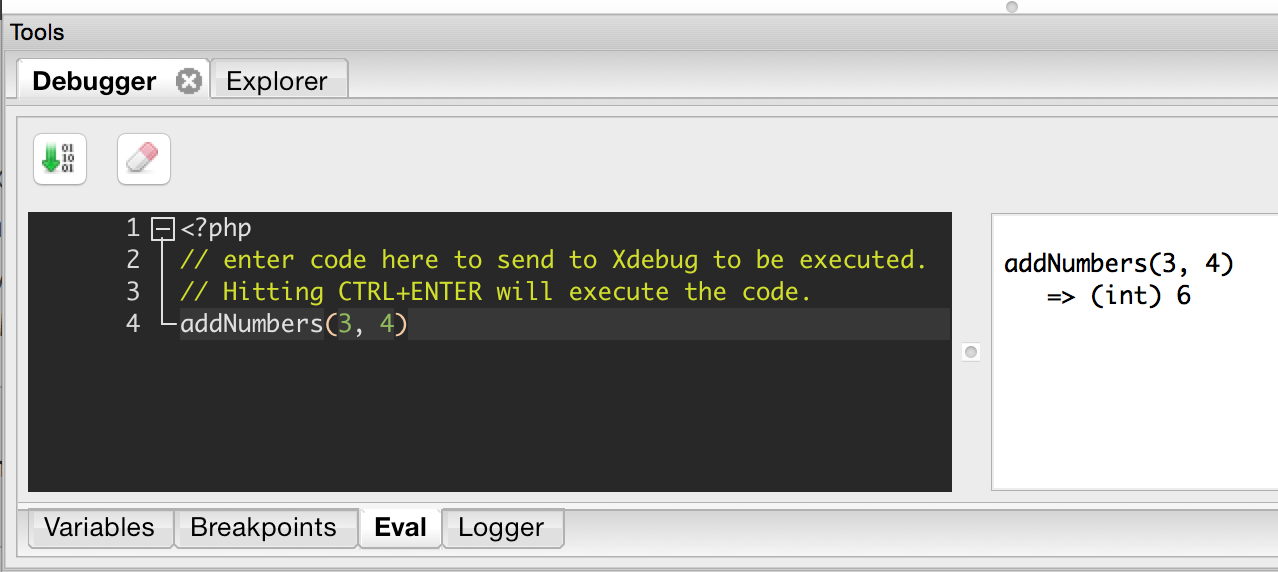
Evaluating Expressions
We look at the line 4 of buggy.php and say to ourselves "Hey, that does not look right!" And indeed that is
the case. But let's say that we want to make really sure that the bug is inside the addNumbers
function. Triumph allows us to evalute code even though the script is paused. In Triumph, go to
the debug panel and then click the "eval" tab. In this tab, you type in any PHP code that you
want to be run. Note that the code that you type in here will be evaluated against the
current scope. Since we suspect that the function is incorrect, lets try to call it
with other numbers. Enter the following in the eval tab text box, and then enter CTRL+ENTER
(or CMD+ENTER on Mac OS X):
addTwoNumber(3, 4)
You will see this in the right hand side
   addNumbers(3, 4)
       => (int) 6
What Triumph just did is execute PHP code using the state of the script! You can imagine how
useful this is, as you can execute code while stepping through code, enabling you to quickly
pin-point the misbehaving code. Eval is also great for inspecting deep nested arrays, as you
can type in something like $users['34']->getFullName() without needing to click around the
variables tree.
Incorporate XDebug into your every-day work
Hopefully the XDebug install process didn't overwhelm you! It can be a bit tricky sometimes, but
you only have to go through it once. After that, starting the debugger is just two mouse-clicks
away in Triumph. You can see how Triumph's XDebug support can be a great time-saver. You no longer
need to litter your code with var_dump to debug your code, only to remove them once you figure
out the problem. The number of browser refreshes is cut down tremendeously, as stepping through
your program allows you see exactly which line of code is executed, and what the values of
the variables were at the time. Triumph makes it easy to add breakpoints so that you control
the exact location where execution stops. Triumph shows you in plain view the values of variables.
Finally, Triumph allows you to very easily execute functions and other arbitrary code as
the execution is paused so that you can pin-point faulty code. Next time you find yourself
in a 2-hour bug-hunting session, fire up Triumph's debugger! You won't regret it.
Triumph 4 PHP is available now! Buy it today.